
The lactate meter
Feel guesses. RZT measures.
One drop of blood, five seconds, and the pace you thought was easy shows its true colours. Two thresholds, measured not inferred, and the training zones that follow from them.
Lactate
One of the most widely used markers in endurance sport.
Long mistaken for a waste product of exercise, lactate is now used to measure the real intensity of a session, locate the thresholds and fine-tune each athlete’s training.
But you have to measure under the same conditions every time, or two tests can’t be compared. So RZT set a single protocol, applied to every profiling session.
Drag along the curve: intensity, lactate, zone.

Four myths, four cards.
-
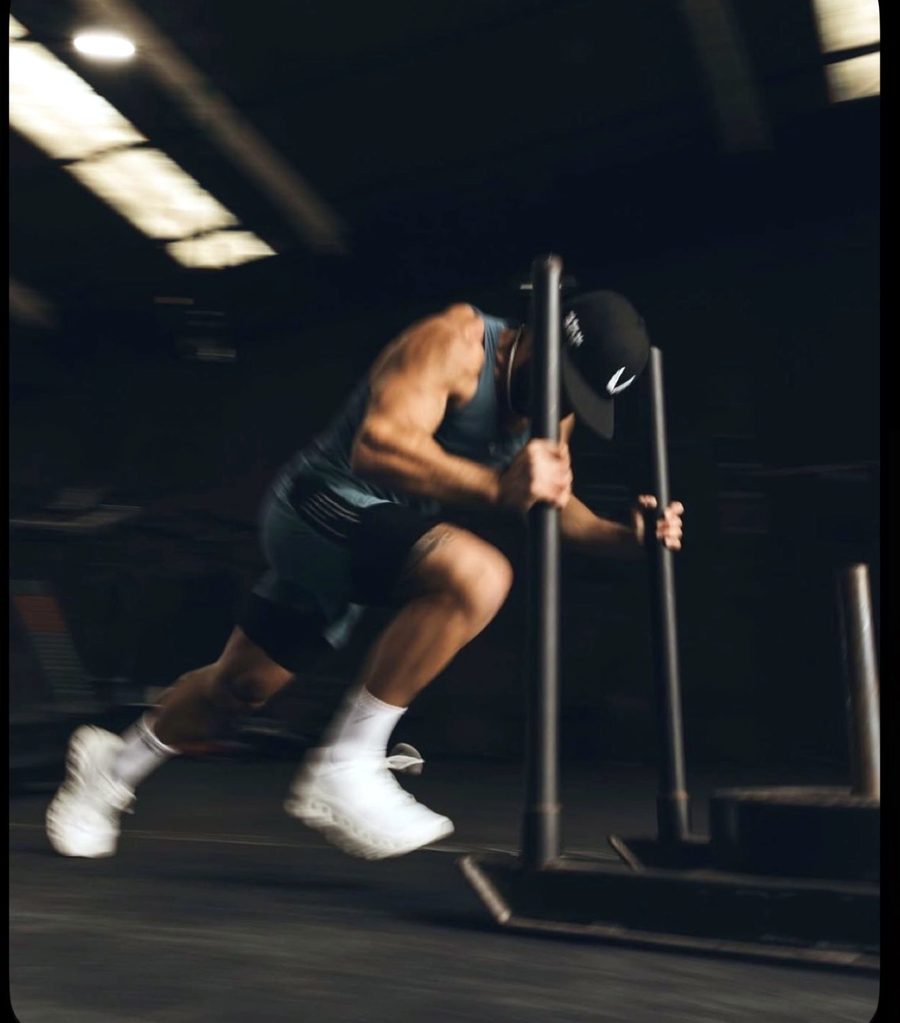
A fuel, not a waste product
Turned back into energy by the muscles, heart and brain, lactate travels from the fibres that produce it to the ones that use it.
-
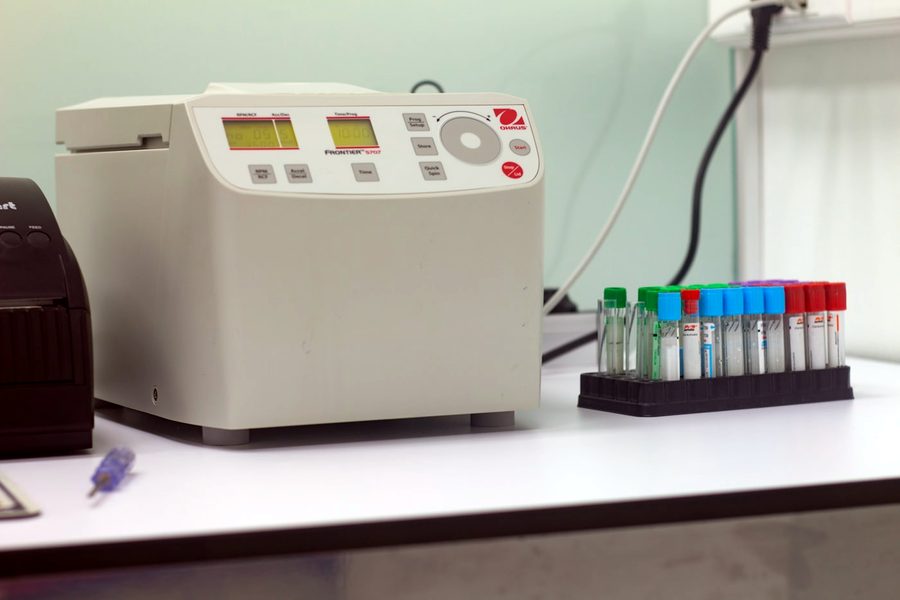
Lactic acid doesn’t exist
What’s measured in the blood is lactate, its ionised form. “Lactic acid” is a shorthand that physiology has dropped.
-

It doesn’t cause the burn
The burning feeling in your muscles comes from local acidosis linked to hydrogen ions, not from lactate itself.
-
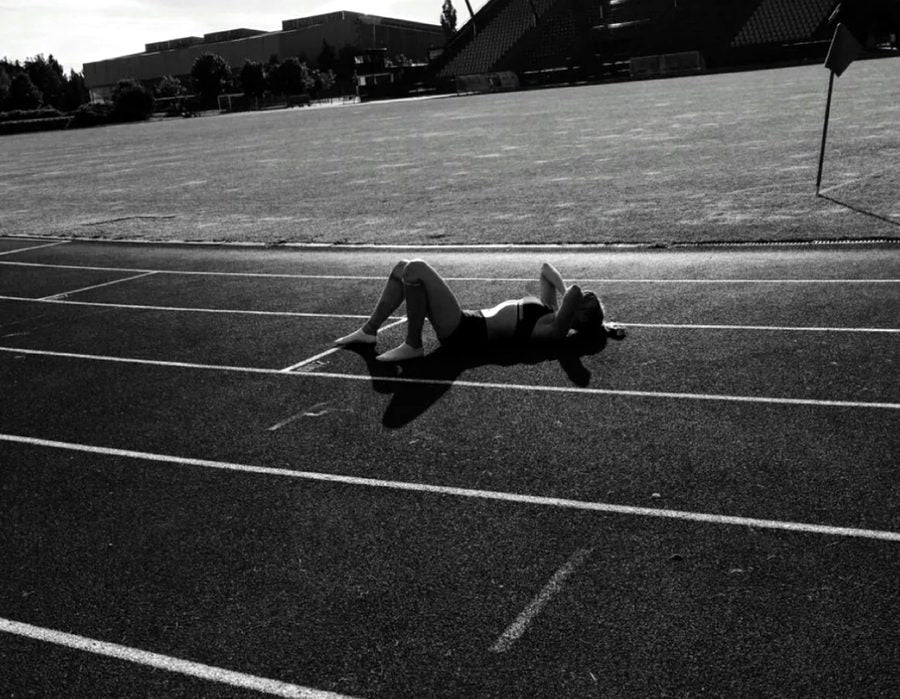
Nor does soreness
Muscle soreness is micro-damage to the muscle after exercise. Lactate, by contrast, is cleared within tens of minutes.

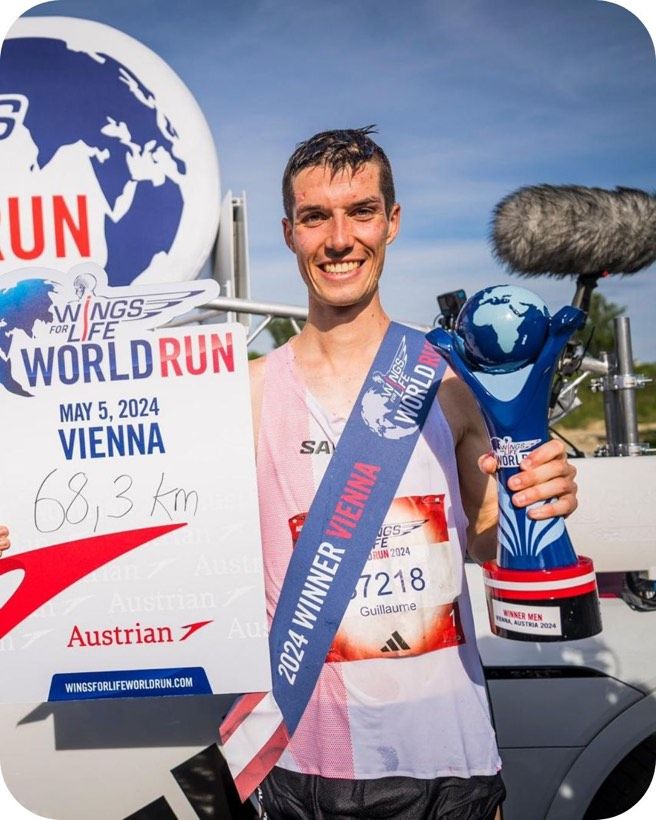
“It helps me target my training zones precisely, optimise my sessions and prevent injuries.”
They train by the data.
-
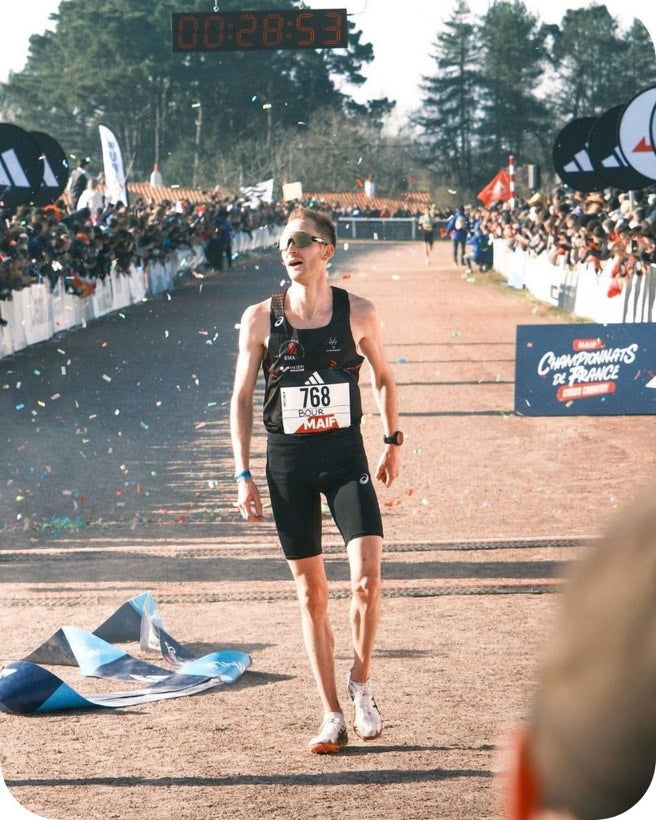
Félix Bour
Distance · marathon
Marathon 2:06:41 · 10,000 m 27:27 · Paris 2024 Olympics
-
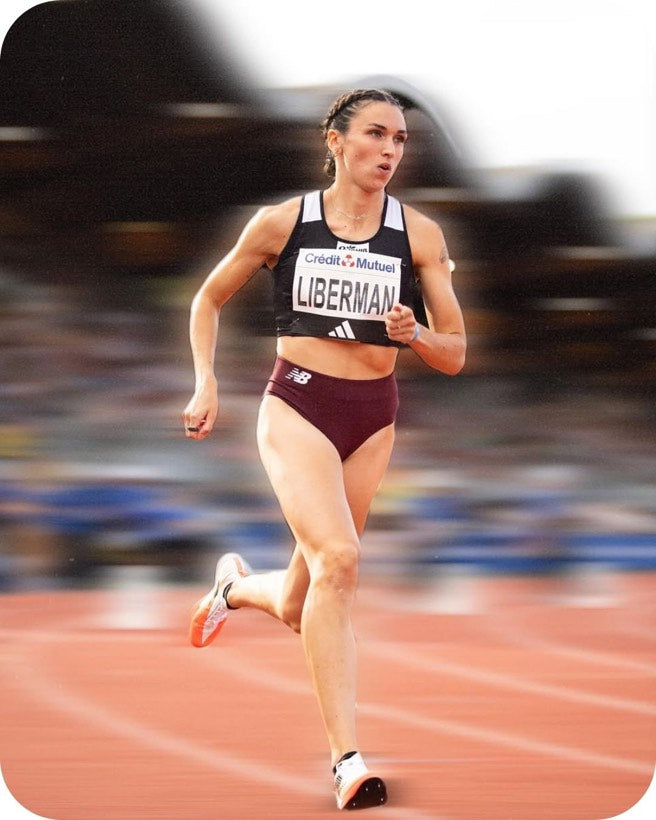
Clara Liberman
800 m
1:58.82 · European indoor silver 2025
-
Guillaume Ruel
Road distance
European 50 km record · French 100 km record
-
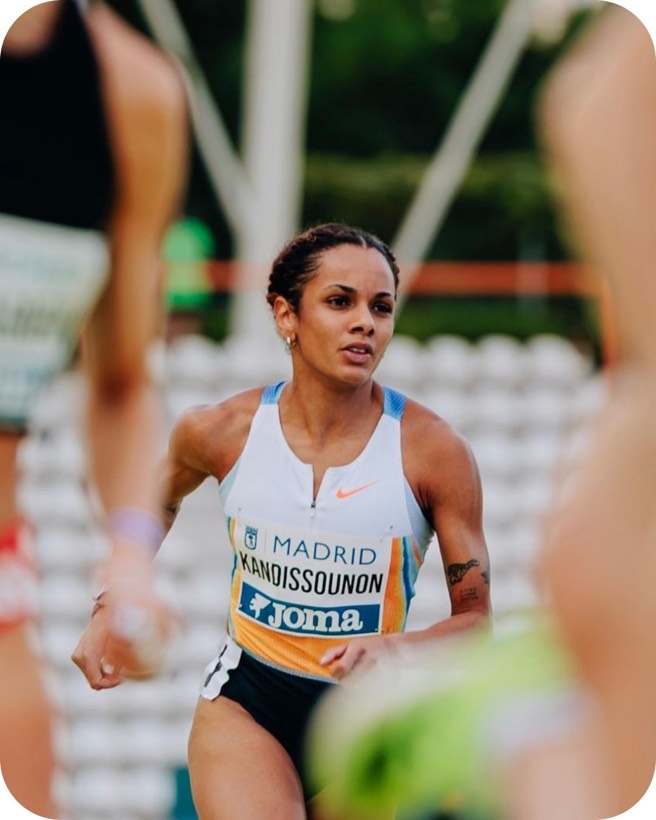
Léna Kandissounon
800 m and 400 m
800 m 1:59.65 · 400 m 52.61 · Paris 2024 Olympics
-
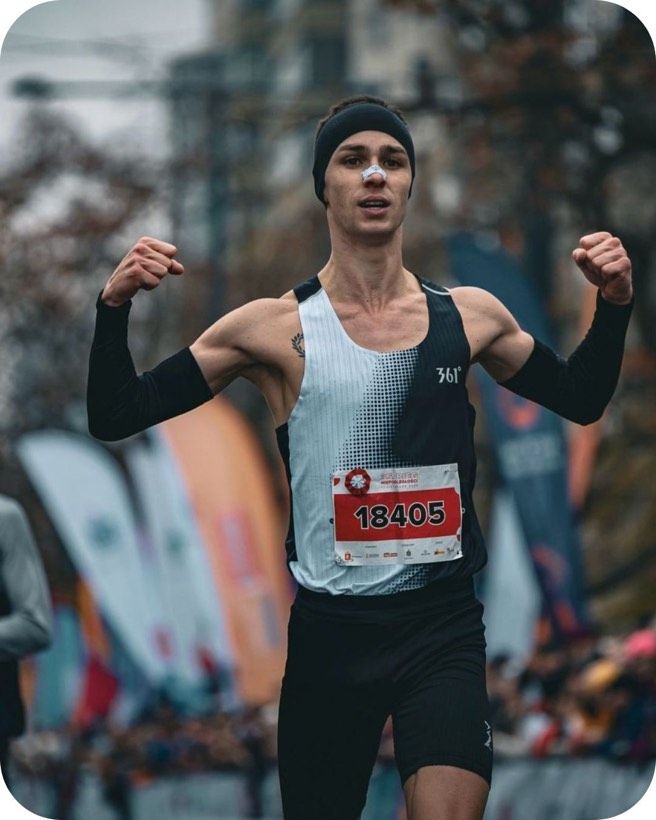
Clément Deflandre
1500 m to half marathon
9-time Belgian champion · half marathon 1:02:33
-
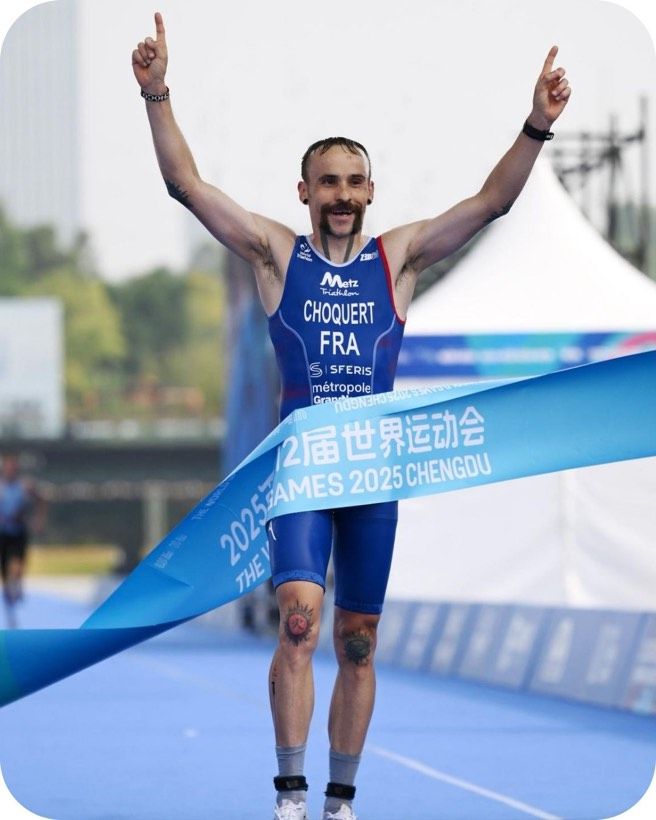
Benjamin Choquert
Duathlon · marathon
World champion 2019 and 2025 · marathon 2:07:41
-
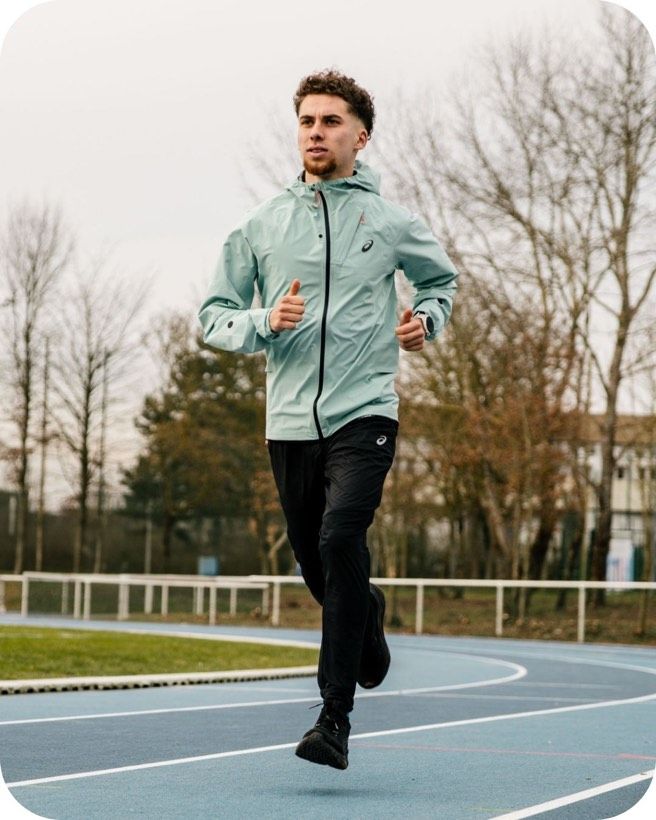
Suleyman Yalaoui
800 m to 10 km
6th at the European U20 Championships · French U23 runner-up
-
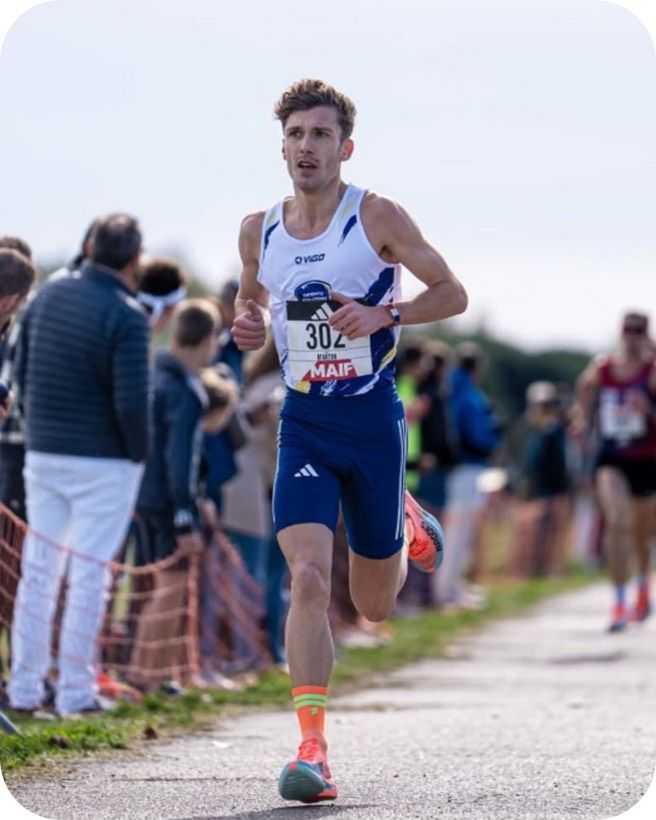
Martin Desmidt
1500 m to 10 km
5000 m 13:31 · 1500 m 3:36.73
And the clubs and teams behind them.
Clubs, training groups, labs and sports shops follow the same protocol, with the same meter.
-

-
TRC
-

-
Run Lab
-

-

-

-

-

-
Club de Poitiers
-
Running Peps
-
Eight Lines
-

-
800 GP
-


All the science of training, in one app.
The RZT app doesn’t just display a lactate value: it guides each user through the RZT physiological profiling protocol, interprets the data collected, identifies the thresholds, generates training zones and turns every test into personalised recommendations. It is developed with Guillaume Boitel, PhD in exercise physiology, to open up methods usually reserved for laboratories and elite set-ups.

Scientific lead
Guillaume Boitel
PhD in exercise physiology
Access to the app is reserved for owners of an RZT meter.
Hello
Léa
Current thresholds
up to dateYour progress
- Profile and physiologyWeight, discipline, personal data
- Reports and history4 tests · last on 18 Jul
Interface preview. Sample values.
The app
From sample to programme.
Understand the tool before you measure.
An interactive tutorial introduces the meter, the measurement and common mistakes. The meter is only an instrument: what counts is the data it produces and what you do with it.
- Getting to know the meter, part by part
- Sampling video: at rest, during and after exercise
- Cleaning, blood volume, inserting the test strip
Your physiology has a starting point.
Before your first protocol, the app builds your baseline profile. You can change everything afterwards.
- Main discipline, level, years of training
- Weekly volume, number of sessions
- Goal, target distance, race date
- Variables that affect how thresholds are read
The same protocol, every test.
The RZT protocol standardises every step of the test, so two measurements three months apart stay comparable.
- Choice of setting: track, road, treadmill, turbo trainer
- The day’s context: sleep, nutrition, how you feel
- At each stage: when to measure, when to sample, when to log
- Automatic move to the next stage
A snapshot of your level, right now.
At the end of the protocol, the scientific engine calculates and interprets. The report joins your history and becomes a benchmark.
- LT1 and LT2 thresholds, with their paces and speeds
- Individual training zones
- Written physiological analysis
- Full PDF report, archived and comparable
A programme built on your thresholds.
From the report, the app generates sessions matched to your profile, discipline and goal, then adjusts them to how you actually are.
- Sessions calibrated to your current zones
- Weekly update: weight, sleep, nutrition
- Full history of tests and reports
- How your thresholds change over time
Understand before you interpret.
The learning content follows the logic of the RZT method: understand the physiology, then read your data, then turn it into training decisions.
- Lactate, energy systems, mitochondria
- Physiological thresholds and how they change
- How to read a profiling report
- The RZT guide and official protocols
60 minutes, your curve live.
A step test, from the first sample to the training plan. The app guides every stage of the RZT protocol, records your measurements and plots the curve while you run.
-
01
Warm-up
Plus a first baseline sample, at rest
-
02
Step test
Rising intensity, one measurement per stage
-
03
Your curve
The app plots the curve and places LT1 and LT2
-
04
Your zones
A training plan set by your data
Order
Three pieces between you and your curve.
One test strip and one lancet per sample, nothing more. The instrument first, then its two consumables.

Lecteur Lactate Fora X + 10 bandelettes + 100 autopiqueurs

Bandelettes de lactate
